By LARRY SWEDROE
One of the more common mistakes made by investors in index funds, and other passively managed vehicles (funds that invest systematically following fund construction rules and do not engage in individual stock selection or market timing), is that because they view all index funds in the same asset class (such as small cap or small value) as basically the same, the only criteria they use when choosing an index fund to purchase is the fund’s expense ratio. While the fund’s expense ratio certainly should be a consideration, it should not be the only criteria. To demonstrate that this is the case, we’ll examine the performance of two small-cap indexes, the Russell 2000 and the S&P SmallCap 600.
For the longest period we have data, from January 1994 through November 2019, while the Russell 2000 Index returned 8.81 percent annualized with an annualized standard deviation of 18.87 percent, the S&P SmallCap 600 Index returned 10.46 percent annualized with an annualized standard deviation of 18.14 percent. The S&P 600 far outperformed the Russell 2000 and did so while experiencing less volatility and with great persistence, outperforming more than two-thirds over rolling one-year periods, more than 90 percent over rolling three-year periods, and close to 100 percent over rolling five-year periods. How can two small-cap indexes produce such dissimilar results?
As highlighted in S&P’s September 2019 research paper A Tale of Two Small-Cap Benchmarks, the two indexes have construction rules that explain the variation in performance. For example, a major part of the outperformance was explained by S&P’s inclusion of a profitability factor embedded in the S&P SmallCap 600 Index. The authors also noted that the S&P 600 benefited from including firms with not only greater profitability, but greater liquidity and higher investability (greater free float). However, I note that while returns were higher for both individual factors, the alphas were not statistically significant and the Sharpe ratios were not superior.
The following table from the paper highlights the major differences in construction rules that contributed to the outperformance of the S&P index.
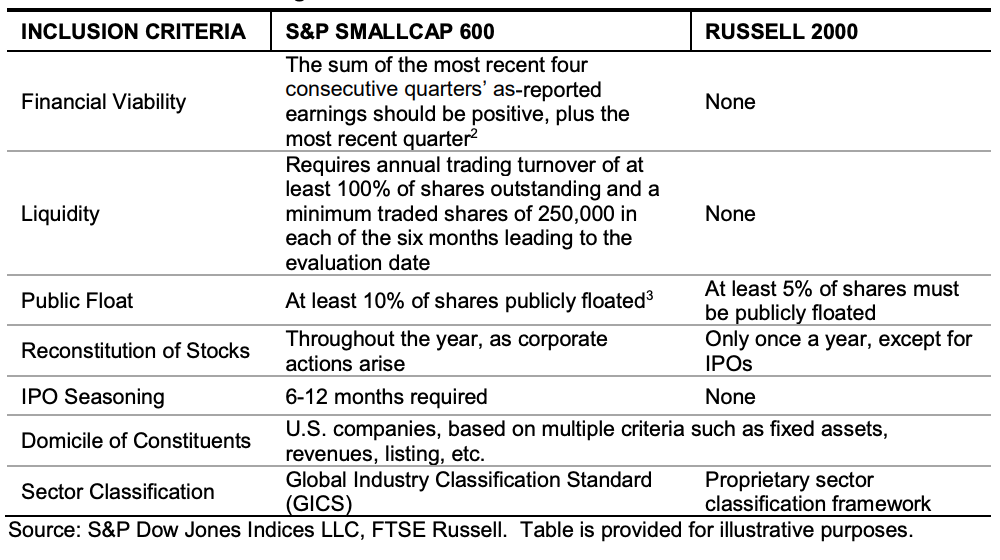
Of particular note is that S&P makes changes to the index on an “as needed” basis, reducing the transparency that allows active managers to front-run changes in other indexes. S&P’s paper cited the well-documented research showing the negative impact on the Russell index from rebalancing and reconstitution. And by examining returns by calendar month, they showed that the greatest outperformance was in the month following reconstitution, July (t-stat of 2.7, significant at the 5 percent confidence level). However, they did note a declining level of outperformance (16 basis points less than 10 years ago), as Russell has made some changes to decrease the impact.
Another key finding was that firms that had positive earnings in the most recent four consecutive quarters and the most recent quarter (a greater percentage of stocks in the S&P index meet that criteria) outperformed those that did not. Likewise, they found that S&P’s stricter free-float requirement (10 percent versus 5 percent for Russell) resulted in 91 percent of stocks in the S&P index having at least 50 percent of shares publicly floated versus 81 percent for the Russell index. S&P also has an annual share turnover requirement of at least 100 percent and a minimum share volume of at least 250,000 in the prior six months. These screens are there to address the issue of greater trading costs for small-cap stocks. They also found that stocks that met that criteria produced higher returns in both indexes. Thus, the S&P index benefited more.
S&P’s research paper also showed that when they combined the three metrics of profitability, investability and liquidity (which included not only a measure of free float but also trading volume), they found that stocks that met all three criteria outperformed those that did not by between 1.3 percent (for the S&P small-cap universe of 2,460 stocks) and 1.6 percent (for the Russell 2000). Both figures were statistically significant, and they also produced higher Sharpe ratios. However, it is worth noting that the results were actually weaker than the measurements on profitability alone. This is consistent with the findings that investability and liquidity were not individually significant for returns. The benefits of investability and liquidity filters do offer the potential for lower transaction costs.
The research paper next examined the results of a four-factor (beta, size, value and quality) regression. It showed that the S&P index benefited from a highly significant 0.25 loading on the quality factor (because of its profitability screen), while the Russell index had a statistically insignificant exposure of just 0.03.
Finally, the fund construction rules led to a dramatic difference in turnover—just 13.34 percent for the S&P 600 versus 38.77 percent for the Russell 2000. Not only does that lead to much lower implementation costs (an estimated 16 basis points for the S&P index versus 47 basis points for the Russell index) but to greater tax efficiency as well.
We’ll take a brief look at the asset class of U.S. small value stocks to see how different indexes can produce different outcomes. And we’ll use a different index provider as well. Here we compare the returns of the MSCI US Small Cap Value Index to the returns of the Russell 2000 Value Index. From 1994 through November 2019, the MSCI index’s return of 10.37 percent outperformed the Russell index’s return of 9.56 percent by 0.81 percentage point per annum, although it did so with a slightly higher annualized standard deviation—17.09 percent versus 16.55 percent. Once again, we see that the selection of indexes matters because different indexes on similar universes can produce very different performance results. The different outcomes can result from how the index defines value. For example, Russell uses only the price-to-book (P/B) metric, while MSCI uses dividend yield and forward-looking price-to-earnings in addition to P/B.
Before summarising, the above data provides another important lesson. When examining the performance of an active fund versus its self-declared benchmark, be aware that the active fund will almost certainly choose the benchmark that is easiest to beat (now you know why most active small-cap mangers will choose the Russell 2000 over the S&P 600). On the other hand, you should compare the performance of the active fund versus the optimal passively managed fund choice.
Summary
Prudent investors begin their investment journey by creating an investment plan in the form of an investment policy statement (IPS). The IPS defines the investor’s goals and the specific asset allocation they will use to achieve those goals. Once the asset allocation is determined, the next decision is the choice of investment vehicles that will be used to gain exposure to each of the respective asset classes and/or factors (such as profitability, quality and momentum). For investors in passively managed vehicles such as index funds, the choice is much simpler than it is for active investors because the universe of funds from which to choose is much smaller. However, the evidence presented above demonstrates that even for index fund investors, the choice should not be as simple as just looking at the expense ratios of the various alternatives and choosing the cheapest one. All index funds (and all passively managed funds) are not created equal.
While the expense ratio is certainly an important consideration, it should not be the only one. The reason is that the fund sponsor can add value in ways that have nothing to do with “active” investing (defined as the use of individual stock selection and or market timing). Let’s explore some of the ways a fund can add value in terms of portfolio construction, tax management and/or trading strategies.
1. Choice of benchmark index, or how a fund defines its asset class
As demonstrated above, this choice impacts returns in several ways:
— Turnover, which impacts trading costs and tax efficiency. Some indexes have higher turnover than others. And some indexes have buy and hold ranges that are designed to reduce the negative impact of turnover (both on transaction costs and tax efficiency). Buy and hold ranges also take advantage of the momentum effect. And they make the fund’s trades less transparent and less open to front running.
— Greater exposure to common factors that have historically demonstrated premiums (such as size, value, momentum and quality).
— Correlation of the fund to the other portfolio assets (the lower the correlation, the more effective the diversification).
— A fund can add value by incorporating the momentum effect by temporarily delaying the purchase of stocks that are exhibiting negative momentum and by temporarily delaying the sale of stocks exhibiting positive momentum.
— A fund can screen out certain securities (even if they are within the defined index) that have characteristics that have demonstrated poor risk/return (e.g., stocks in bankruptcy, penny stocks and IPOs).
— How often an index reconstitutes can impact returns. Most indexes (e.g., the Russell and RAFI Fundamental Indexes) reconstitute annually. The lack of frequent reconstitution can create significant style drift as stocks migrate throughout the year, lowering exposure to key factors. For example, a Dimensional study found that from 1990 through 2006, the percentage of stocks in the Russell 2000 in June that would leave the index when it reconstituted at the end of the month was 20 percent. For the Russell 2000 Value Index, the figure was 28 percent. The result is that a small-cap index fund based on the Russell 2000 would have seen its exposure to the small-cap risk factor drift lower over the course of the year. For small value funds based on the Russell 2000 Value Index, their exposure to both the small and value premiums would have drifted lower. The drift toward lower exposure to the risk factors results in lower expected returns. To avoid this problem, many funds reconstitute on a more frequent basis (either daily or monthly).
2. Patient trading
If a fund’s goal is to replicate an index, it must trade when stocks enter or exit an index, and it must also hold the exact weighting of each security in the index. A fund whose goal is to earn the return of the asset class and that is willing to live with random tracking variance can be patient in its trading strategy, using market orders and block trading that can take advantage of discounts offered by active managers. Patient trading reduces transaction costs, and block trading can even create negative trading costs in some cases.
3. Tax management
While indexing is a relatively tax-efficient strategy (due to relatively low turnover), there are ways to improve the tax efficiency of a fund. The first is to harvest losses whenever they are significant. The second is to eliminate any unintentional short-term capital gains (those that are not the result of acquisitions). The third is to create wider buy and hold ranges in order to reduce turnover. A fourth is to trade around dividend dates. Unfortunately, most of the investing public is unaware of many of these differences, which collectively can have significant impacts on the returns of funds that appear to be substantially similar on the surface.
4. Securities lending
Securities lending, as the term implies, refers to the lending of securities by one party to another. Securities are often borrowed with the intent to sell them short. Securities lending tends to be more valuable in small stocks than in large stocks. In the international markets, there is another reason for securities lending to occur that has to do with reducing foreign tax withholding. Thus, the opportunities to add value are greater in foreign markets. As payment for the loan of the security, the parties negotiate a fee. The commercial terms of securities lending programs vary from fund to fund, and some mutual funds are more aggressive than others in this area.
A final reason why cost isn’t everything
There’s one final example that demonstrates the importance of considering more than just the expense ratio. Consider two hypothetical funds in the alternative lending space (consumer, small business and student loans). Fund A has a management fee of 1.5 percent. Fund B has a management fee of 2 percent. Since they tend to buy loans of the same quality and duration, the “obvious” choice would be Fund A.
Digging a bit deeper, however, leads to a different conclusion. The reason is that while both funds use a small amount of leverage (30 percent) to enhance returns in a low volatility asset, Fund A charges its fee on all assets and Fund B charges its fee only on investor capital. Thus, 30 percent leverage allows each fund to borrow about $40 for each $100 of investor capital. That means that Fund A is charging 1.5 percent on $140 of assets under management (AUM), or $2.10, while Fund B is charging its 2 percent fee on just the $100 of investor capital, which equals $2, or 1.42 percent on AUM. In addition, the typical fee charged by servicers of the loans purchased is 1 percent, which is the fee paid by Fund A. Fund B, thanks to its scale, is able to negotiate much lower fees, 0.6 percent, or 0.4 percentage point lower. If we subtract the 0.4 percent value added, we get a “net” expense on AUM for Fund B of about 1 percent. Now, instead of Fund A looking about 25 percent cheaper, it looks 50 percent more expensive! It’s important to dig deeper to learn the correct answer—you are looking for value added, not the cheapest alternative.
The lesson learned is that while fees are certainly an important consideration, they should not be the only one when you are weighing two identical funds (in other words, the choices are perfect substitutions for each other).
LARRY SWEDROE is Chief Research Officer at Buckingham Strategic Wealth and the author of 17 books on investing, including Think, Act, and Invest Like Warren Buffett.
If you’re interested in reading more of his work, here are his other most recent articles for TEBI:
The simple explanation for value’s underperformance
Are profesional investors prone to behavioural biases?
Are stock buybacks bad for shareholders?
Which factors guide investors’ decisions on asset allocation?
Just how efficient are equity markets?
Is the growth of passive investing increasing volatility?