By LARRY SWEDROE
Investing is the only endeavour I know of in which, when something gets cheaper, investors tend to want to buy less of it. For example, the performance of value stocks over the past decade has led many investors to either question their value strategy, or worse, abandon it.
Over the 10-year period 2010 through 2019, the Russell 3000 Growth Index returned 15.1 percent per annum, outperforming the 11.7 percent return of the Russell 3000 Value Index by 3.4 percentage points a year, a total return difference of about 104 percentage points (306 percent versus 202 percent).
Before digging into the data to determine to what we can attribute the outperformance, it’s important to note that virtually all the outperformance occurred over just the last three years of the period, 2017-2019. From 2010 through 2016, the Russell 3000 Growth Index returned 13.0 percent while the Russell 3000 Value Index returned 12.8 percent, and the total return difference was only about 4 percentage points (136 percent versus 132 percent). This is important to note because a reversal in performance can occur just as quickly, as you will see. With that in mind, let’s look at the underlying cause of the outperformance of growth stocks.
At the end of 2009, the Shiller cyclically adjusted price-to-earnings ratio (CAPE 10) was just over 20. At the end of the decade, it was about 31, an increase of more than 50 percent. That increase helps explain much of the great performance of the market over the decade. However, the changes in valuations for growth and value stocks were very different. Thanks to the research team at Avantis Investors, we see that rising valuations benefited growth stocks to a much greater degree. In fact, there are two cases where value performance was hurt by a negative change in its absolute valuation.
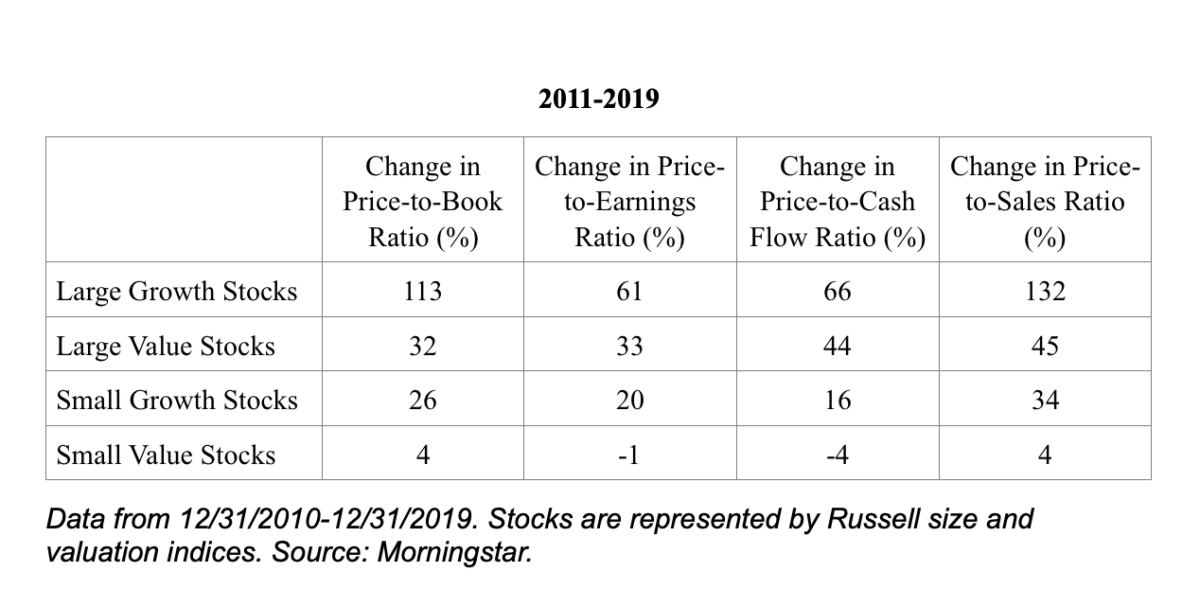
The bottom line is that the outperformance of growth was mainly due to the change in valuations. We did not experience a regime change in which the return on equity of growth companies unexpectedly far outperformed that of value companies. For example, Robert Arnott, Campbell Harvey, Vitali Kalesnik and Juhani Linnainmaa, authors of the December 2019 study Reports of Value’s Death May Be Greatly Exaggerated, found there has been little change in the difference in overall profitability of growth and value in the periods pre- and post-2007. They found that an overwhelming portion of the underperformance of value since 2007 was due to it becoming considerably cheaper relative to growth. Value cheapened by more than 4 percent per year, creating a performance shortfall of just over 3 percent per year.
Since there is no evidence of investor ability to forecast such changes in valuations, the question investors should be asking is what tends to happen after such periods of changing valuation spreads. Again, Avantis’ research team provided the answer by examining the performance differences over the five years following periods of above- and below-average valuation spreads. This should be of particular importance because the valuation spread between value and growth stocks is currently at a historically extreme high level, the 97th percentile in the U.S. And it is even more extreme in international markets.
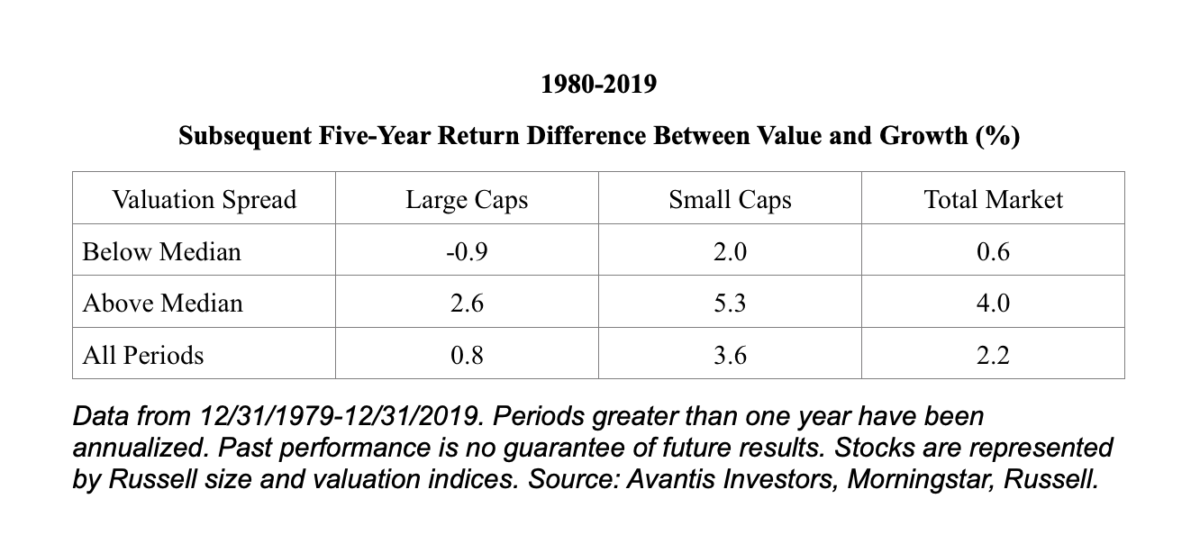
As you can see, periods following above-median valuation spreads experienced much better future relative performance for value stocks versus growth stocks The premium was almost seven times as large (0.6 versus 4.0) after periods of above-median valuation spreads than after periods of below-median valuation spreads. In addition, over all periods the performance gap is much wider (4.5 times as wide) in small than in large stocks (0.8 versus 3.6). This shows that there is information in the spread in valuations between growth and value stocks. For example, in terms of the cash flow-to-price (price-to-book) metric, Avantis found that when the spread was in the 25th percentile, over the year value underperformed growth by an annual average of 3 (6) percent. However, over the next 10 years value still outperformed growth by an annual average of 3 (2) percent. Note the importance of taking a long-term perspective. When the spread was at the 75th percentile, over the next year value outperformed by an annual average of 12 (14) percent, and over the 10 years it outperformed by an annual average of 7 (7) percent.
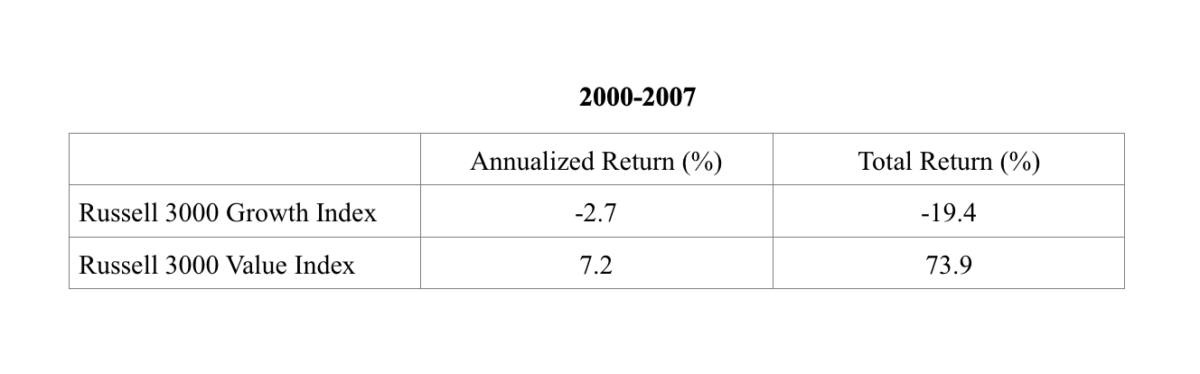
This certainly doesn’t guarantee the future outperformance of value stocks; there are no guarantees when investing in risk assets. Investing is, however, about putting the odds in your favor. And here the evidence is clear — the odds favour value over growth by more than almost any other period we have experienced, with the only recent exception being the bursting of the bubble in growth stocks in March 2000. The following table shows you what happened when that bubble burst.
Thanks to the research team at Dimensional, we can also examine the performance of the value premium (as well as the market beta and size premiums) after periods when they underperformed for 10 years. The data covers the period June 1927 through December 2018, and shows the premium over the succeeding 10 years.
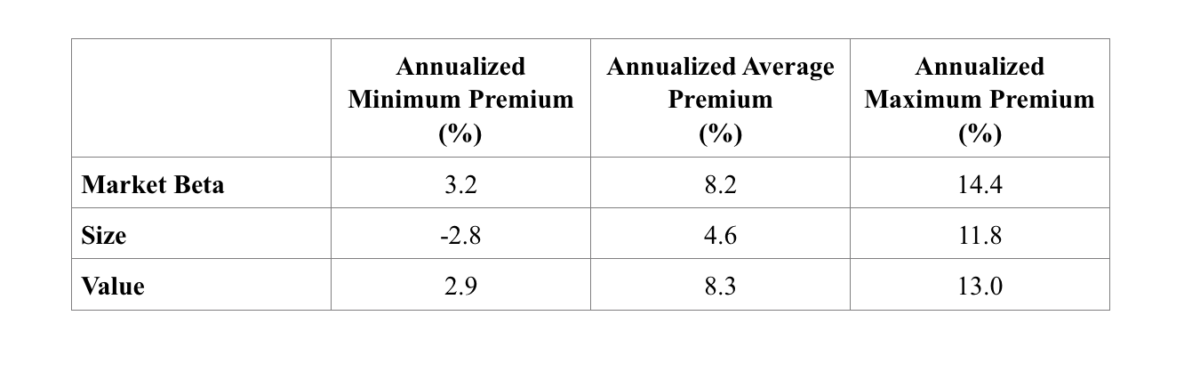
Once again, we see the importance of discipline and patience. Those investors who abandoned a value strategy after 10 years of a negative premium missed out on an annualized premium of more than 8 percent over the following 10 years. The results are very similar to those for the market beta premium. The important message is that 10 years for risk assets is likely to be nothing more than noise, and therefore discipline, adhering to your well-thought-out plan, is the key to investment success. Those who abandon their strategies get the worst of all worlds. They feel the pain of the losses, and then when they abandon the plan, they don’t repeat the benefits.
Takeaway
Over my more than 25 years as an investment adviser, I’ve learned that the biggest problem for investors is making the mistake of recency. “Recency bias” is the tendency to overweight recent events/trends and ignore long-term evidence. This leads investors to buy after periods of strong performance — when valuations are higher and expected returns are now lower — and sell after periods of poor performance — when prices are lower and expected returns are now higher. Buying high and selling low is not exactly a prescription for successful investing. Yet, it is the way many individuals invest. What disciplined investors do is the opposite — rebalance to maintain their well-thought-out allocation to risk assets.
Sadly, while most investors consider three years a long time to judge performance, and five years a very long time, wise investors know that all risk assets go through much longer periods of underperformance. If you doubt that, just consider that the S&P 500 Index underperformed totally riskless one-month Treasury bills over the 13-year period ending 2012, the 15-year period ending 1943, and the 17-year period ending 1982. Of course, over the succeeding periods, they went on to produce spectacular returns—returns that were only earned by those who had the courage of their convictions and stayed the course. The same is true of investors in value stocks—you must be willing to bear the pain of periods of underperformance in order to earn the long-term premium. Which raises the question: How frequent are periods of negative premiums? Thanks to the research team at Dimensional, we have the answer on four factors (market beta, size, value, and profitability):
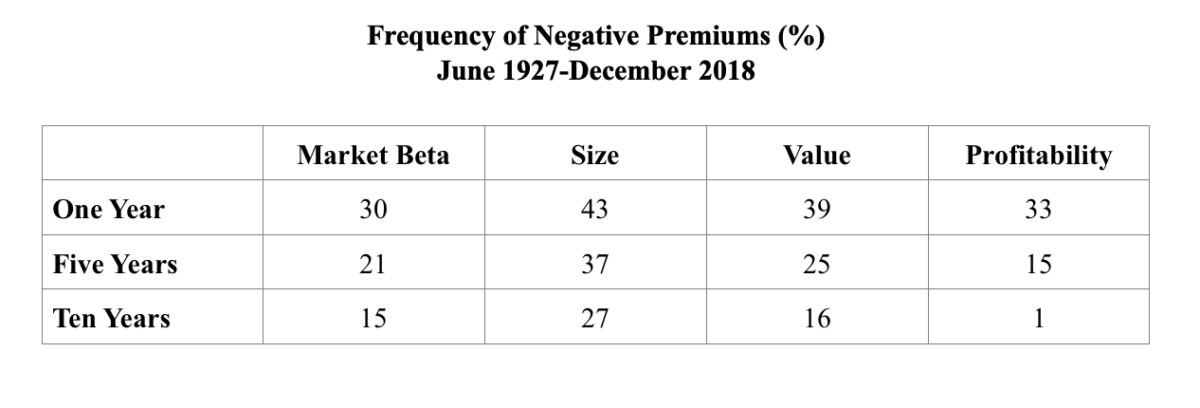
As you can see, all four premiums experienced long periods of underperformance. Even at 10 years, the equity premium was negative 15 percent of the time, not much different than the 16 percent of the value premium. The important lesson is that when it comes to risk assets, 10 years can be nothing more than more than noise — not a reason to abandon the strategy.
Dimensional’s research team provided another important insight related to diversification of risk. The data sample covers the period July 1963 through December 2018. At the one-year horizon, there was a 49 percent chance that any of the four premiums were negative. That figure dropped to just 8 percent for two of the four being negative, to 0.2 percent for three of them being negative, and to zero for all four. This clearly demonstrates the benefits of avoiding concentrating all your risk in a single factor (market beta or any other factor, or source of risk).
The bottom line is that what prevents so many investors from being successful is that they allow their stomachs to make decisions instead of adhering to their well-thought-out plan. I’ve yet to meet a stomach that makes good decisions. Forewarned is forearmed.
LARRY SWEDROE is Chief Research Officer at Buckingham Strategic Wealth and the author of 17 books on investing, including Think, Act, and Invest Like Warren Buffett.
If you’re interested in reading more of his work, here are his other most recent articles for TEBI:
Why the latest attack on passive investing is nonsense
Do active funds perform better in less efficient markets?
Why superstar investors are a dying breed
The investment impact of an ageing population
Factors to consider when choosing an index fund