For two decades now, the SPIVA analysis from S&P Dow Jones Indices has consistently shown how the vast majority of actively managed funds underperform their benchmarks. As a result, most retail investors would be better off using low-cost index funds. But what about institutional asset managers? In theory, they have certain advantages over their retail fund counterparts, including economies of scale and the ability to negotiate lower fees. So how much of a difference, if any, do such factors make? The SPIVA team has just published the first SPIVA Institutional Scorecard, and S&P'S TIM EDWARDS presents the key findings.
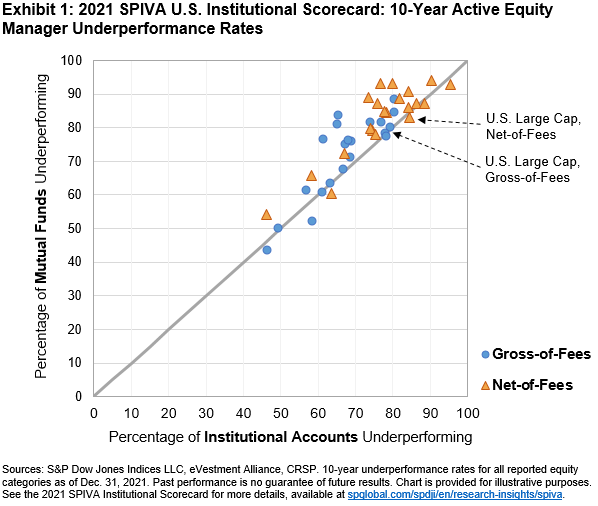
Ptolemy I (367 BC-282 BC), one-time companion of Alexander the Great and later pharaoh of Egypt, has an important role in intellectual history. Among other contributions, he is credited with founding the library at Alexandria, one of the seven wonders of the ancient world, and for personally sponsoring the work of Euclid, a mathematician whose Elements reigned for over 2,000 years as the definitive work on geometry. According to legend, Ptolemy found the textbook too complicated and requested an easier path to understanding, to which Euclid responded, “There is no royal road to geometry.” S&P DJI’s regular SPIVA Scorecards show that relatively few actively managed mutual funds deliver long-term outperformance, particularly in the equity markets and especially in large-cap U.S. equities. The implications of this result remain hotly disputed, especially by active managers. A common objection is that, at least for some princes, an easier path is available. A Ptolemaic fund selector would not simply make a random choice from all the funds available, instead sorting the wheat from the chaff by a robust selection process. Nor would they pay the fees typical of an average investor, instead benefiting from direct access, economies of scale and sharp negotiations. The latest edition of the SPIVA Institutional Scorecard offers perspective on these topics, extending the data of the “classic” 2021 U.S. Scorecard to include the performance of institutional accounts and gross-of-fees performance. For an investor seeking to select outperforming funds, such data should be of particular interest; they reflect the chances of investors who are sufficiently resourced to conduct a careful search and a vigorous negotiation. Exhibit 1 plots the 10-year underperformance rates reported in the Institutional Scorecard for 21 international and domestic U.S. equity categories for mutual funds (on the y axis) and institutional accounts (on the x axis), with gross- and net-of-fees underperformance rates represented by dots and triangles, respectively. The dark grey diagonal highlights an equal underperformance rate within both institutional accounts and mutual funds, and the two data points corresponding to the U.S. Large-Cap Equity category are highlighted for interest.

The chart illustrates several facts of increasing importance. First: the dots fall generally lower and to the left of the triangles, but not by much. In other words, gross-of-fee performance was better, but not by enough to change the overall conclusion. Second, most of the data points are above the diagonal line, implying generally higher underperformance rates among mutual funds than among institutional accounts, both before and after fees. Third, most of the data points are still quite close to the diagonal, implying that mutual fund and institutional account underperformance rates were broadly similar, no matter the equity category. Finally, and most importantly, nearly all the data points in Exhibit 1 are in the top right quadrant. In other words, in most categories, more than 50% of actively managed mutual funds underperformed and more than 50% of actively managed institutional accounts underperformed. A careful search for a skilled manager and paying close attention to costs might improve the odds, but the long-term data suggest that even for the pharaohs of finance, there is no royal road to outperformance.
Dr TIM EDWARDS is Managing Director, Index Investment Strategy, at S&P Dow Jones Indices.
© The Evidence-Based Investor MMXXIV. All rights reserved. Unauthorised use and/ or duplication of this material without express and written permission is strictly prohibited.
