$357 billion is not an insignificant sum. And that's what investors in the United States have saved over the last 25 years by using index funds tracking the S&P 500, S&P 400 and S&P 600. The good news is that, although indexed assets as a percentage of float-adjusted market capitalisation have grown sharply in that time, the figure still stands at a relatively modest 17%. As ANU GANTI from S&P Dow Jones Indices explains, the potential for even greater savings in the future is huge.
In the 20 years ending in 2020, 94% of all large-cap U.S. managers lagged the S&P 500. Mid- and small-cap results were almost equally disappointing. A notable consequence of these shortfalls in active performance has been the rise in passive investing, one of the most significant trends in modern financial history.
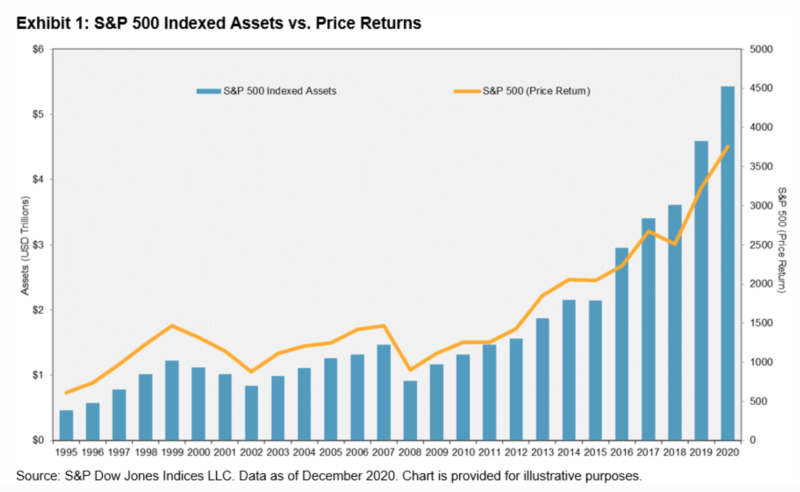
Our recent Annual Survey of Indexed Assets shows a surge in assets tracking the S&P 500 to $5.4 trillion as of December 2020. Exhibit 1 illustrates that this growth outpaced the growth due to market gains, indicating a substantial increase in flows.

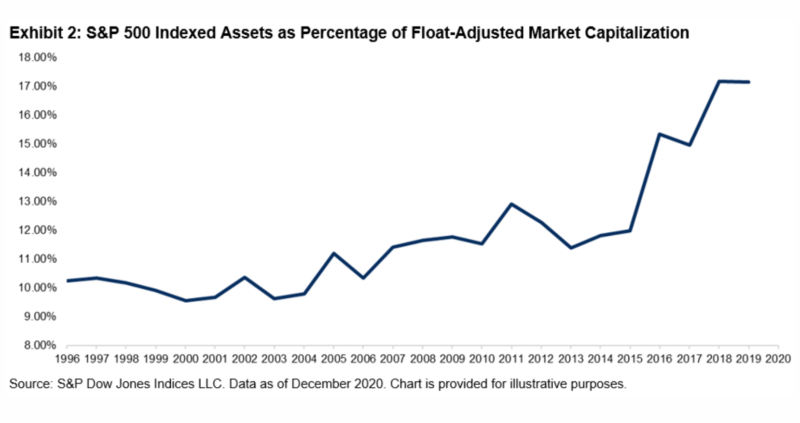
To provide perspective on the size of the passive market, we can analyse indexed assets historically as a percentage of float-adjusted market capitalisation. Exhibit 2 shows that this percentage has grown dramatically, from 10% in 1996 to 17% in 2020. While indexing has grown substantially, the potential for future growth is promising.

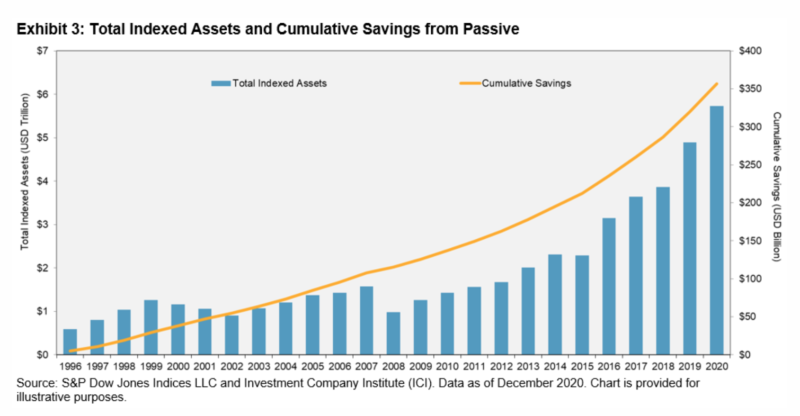
Among the many benefits of indexing is its low cost relative to active management. As indexing has grown, investors have benefited substantially by saving on fees and avoiding underperformance. We can estimate the fee savings each year by taking the difference in expense ratios between active and index equity mutual funds, and multiplying this difference by the total value of indexed assets for the S&P 500, S&P 400 and S&P 600. When we aggregate the results, we observe that the cumulative savings in management fees over the past 25 years is $357 billion (see Exhibit 3).

