By LARRY SWEDROE
While growth stocks produced higher returns on assets and equities and faster growth in earnings than value stocks, value stocks have provided higher returns over the long term. There are several reasons for this result, which likely surprises many investors:
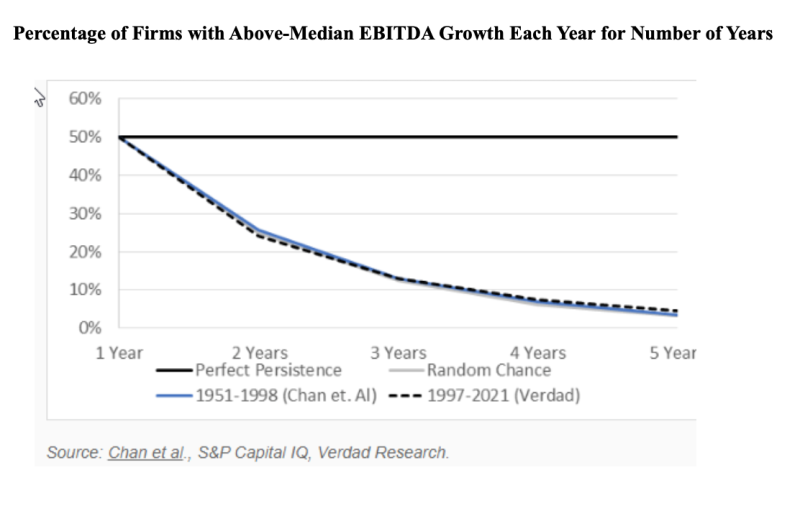
While growth stocks have produced higher growth in earnings, the persistence of abnormal earnings growth was not greater than would be randomly expected, leading to investor disappointment. The chart below shows this graphically. The straight black line at the top is what we’d expect if growth perfectly persisted, meaning that companies above the median growth rate in year one were again above that rate in years two, three, four and five. The gray line is what we would expect if growth does not persist at all, meaning that a company above median growth in year one had a coin flip of a chance at being above median growth in year two, so that the probability of being above median growth for two years in a row is 25 percent and just 3.215 percent for five years running.

The greater exposure to economic cycle risk of value stocks results in investors demanding a risk premium for accepting those incremental risks.
Analysts’ forecasts systematically overshot the actual outcomes; their forecast errors became larger the further down the income statement (earnings available to equity investors) and the further out in time.
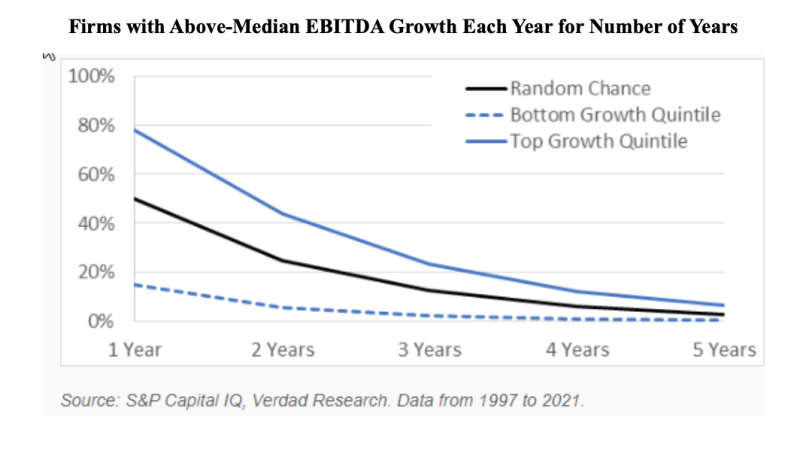
While analysts have been too optimistic in their growth estimates, they have been able to correctly sort companies into high and low growers. Greg Obenshain and Brian Chingono of Verdad showed that the metric of growth in EBITDA (earnings before interest, taxes, depreciation and amortisation) was able to successfully sort companies into high and low earnings growers over the short term. As the chart below demonstrates, while abnormal earnings growth did resort to randomness at year five, 78 percent of top-quintile companies by their EBITDA growth measure were above the median growth rate in year one, and 44 percent were again in year two—far better than random chance and an improvement over analyst projections alone. Conversely, just 15 percent of the bottom-ranked companies were above median growth in year one, and just 6 percent were again in year two.

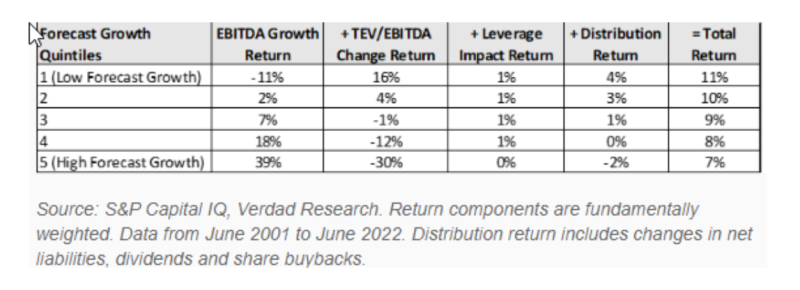
Unfortunately, being able to predict that a company will produce abnormally high earnings growth is a necessary, but not sufficient, condition for generating excess returns (alpha). The reason is that predicting growth isn’t the same as predicting returns! As the chart below demonstrates, predicting high EBITDA growth does not translate to high stock returns. In fact, the stocks in the lowest quintile of growth forecast produced the highest returns, and the stocks in the highest quintile produced the lowest returns.

As Obenshain and Chingono noted: “The key to understanding this apparent paradox is to decompose total returns into the contributions of growth, changes in multiple, leverage, and distributions.” Note that TEV (total enterprise value) equals market capitalisation plus interest-bearing debt plus preferred stock minus cash and equivalents.

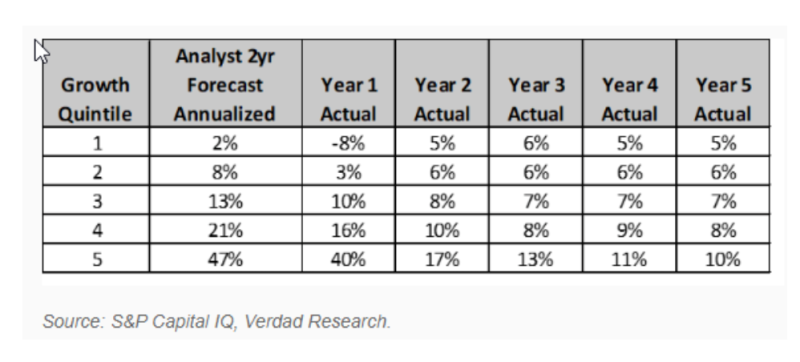
The above table demonstrates that while firms with high forecast growth indeed grew at impressive rates, they also experienced the greatest contractions in their multiples. Multiples contracted because growth did not persist at the levels expected. As Obenshain and Chingono noted: “It’s not the forecast that matters, but the forecast relative to what is already priced in.” The following chart, comparing analyst forecasts with realized growth rates shows that not only are analysts overly optimistic but that abnormal earnings growth shrinks at a rapid pace.

Investor takeaways
The historical evidence makes clear that abnormal earnings growth (both high and low) tends not to persist beyond what we would randomly expect. Thus, as Obenshain and Chingono demonstrated, betting on a company to persistently produce abnormal earnings growth has been a loser’s game—a painful lesson for investors in ARKK, Cathie Wood’s Innovation ETF, which bet on abnormal earnings growth. As of October 15, 2022, the fund had Morningstar one-, three- and five-year percentile rankings of 100 (worst performer), 99 and 95, respectively. The takeaway is that investors need to be very humble when
forecasting earnings growth, understanding that abnormal earnings revert to the mean (GDP growth rate) very quickly, and that by five years there is no abnormal growth beyond the randomly expected.
© The Evidence-Based Investor MMXXIV. All rights reserved. Unauthorised use and/ or duplication of this material without express and written permission is strictly prohibited.
