By CRAIG LAZZARA from S&P Dow Jones Indices
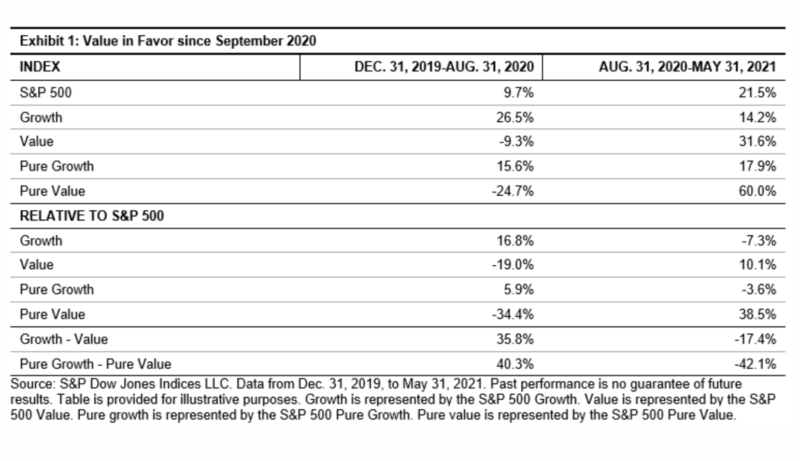
U.S. equity markets seemed to undergo a fundamental change of direction in September of last year. Exhibit 1 illustrates the shift; our growth indices, which had outperformed value handily through the end of August, have lagged ever since. The spreads between growth and value are even greater when we compute them using our Pure Growth and Pure Value indices.

Do the strength and longevity of the value rally suggest that it must be near its peak? To answer directly —
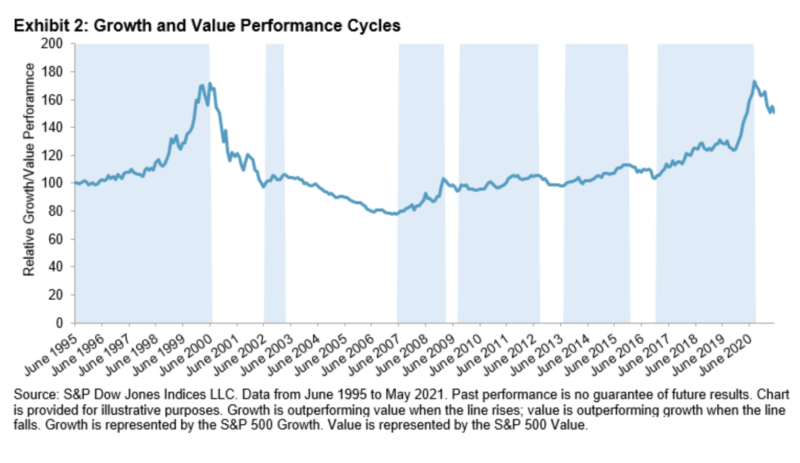
. Whether value continues to outperform growth or suffers a reversal is a function of numerous exogenous variables, prominently including the course of inflation, the level of interest rates, and the prospects for growth as the economy recovers from last year’s shutdowns. History does, however, let us make two observations about the nature of past value rallies. First, as Exhibit 2 illustrates, some
. Since 1995, there have been six cycles when value outperformed growth. The shortest lasted only six months (between February and August 2009). On the opposite side of the ledger, value outperformed for more than
between 2003 and 2007. So
.

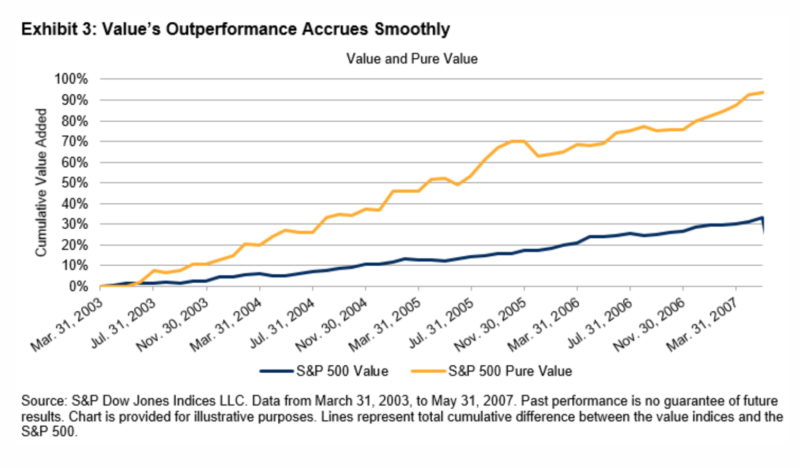
Second, when value has outperformed historically, its
. Exhibit 3 illustrates this for the 2003-2007 value rally, although similar graphs could be (and have been…) drawn for the other periods of value dominance. It’s conceptually possible that, although value outperformed for more than four years, most of the outperformance occurred in the early months, with only a small dollop for latecomers. It turns out that this was not the case; early investors did not reap a disproportionate share of value’s gains.

We don’t know for how much longer the value rally will last. We don’t know what the ultimate margin of outperformance will be. But
, and if it keeps going, history gives us reason to believe that
.
